参见:
http://www.yifanhu.net/index.html

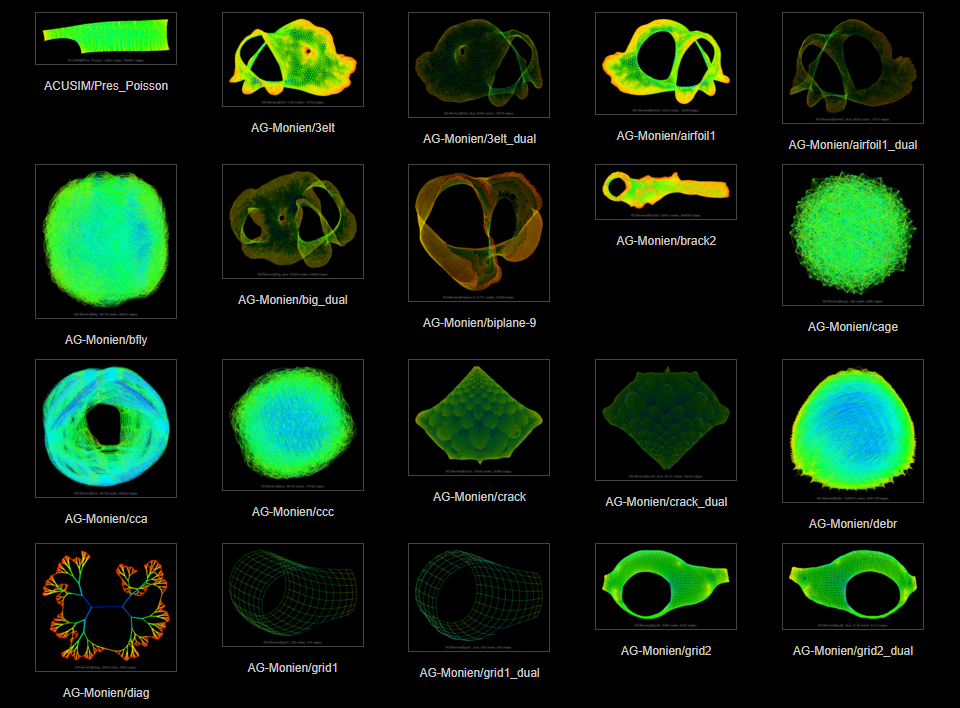
Graph visualization is a way to discover and visualize structures in complex relations. What sort of structures are people who do large scale computation studying? We can get a glimpse by visualizing the thousands of sparse matrices submitted to the University of Florida Sparse Matrix collection using sfdp algorithm . The resulting gallery contains the drawing of graphs as represented by 2568 sparse matrices in this collection. Each of these sparse matrices (a rectangular matrix is treated as a bipartite graph) is viewed as the adjacency matrix of an undirected graph, and is laid out by a multilevel graph drawing algorithm. If the graph is disconnected, then the largest connected component is drawn. The largest graphs have tens of millions of nodes and over a billion of edges. A simple coloring scheme is used: longer edges are colored with colder colors, and short ones warmer. The graphs are in alphabetical order. Use the "Search" link to find graphs of specific characters.